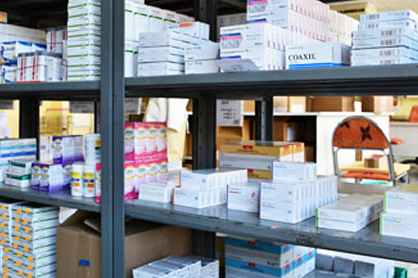
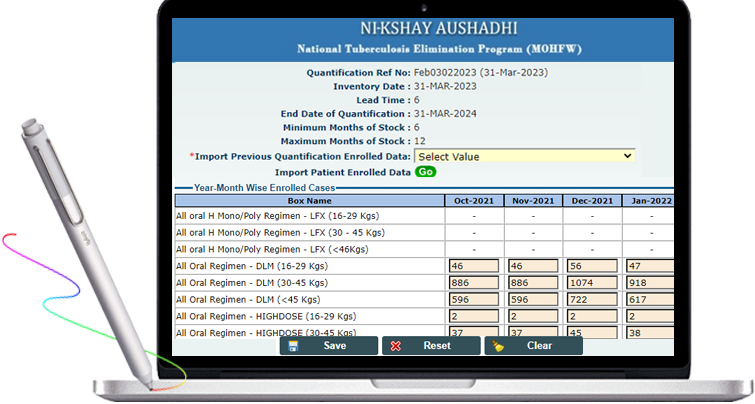
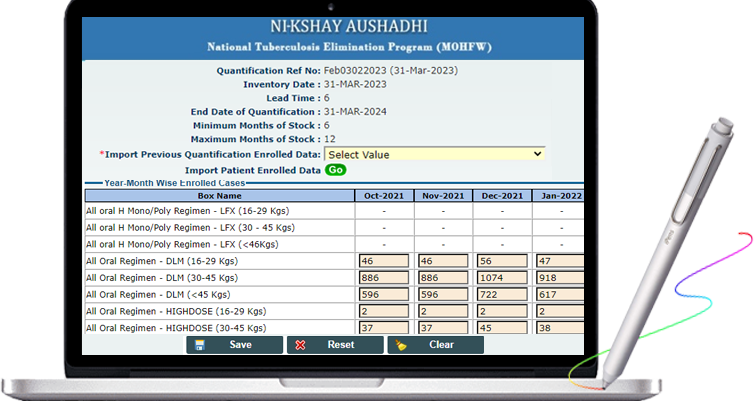
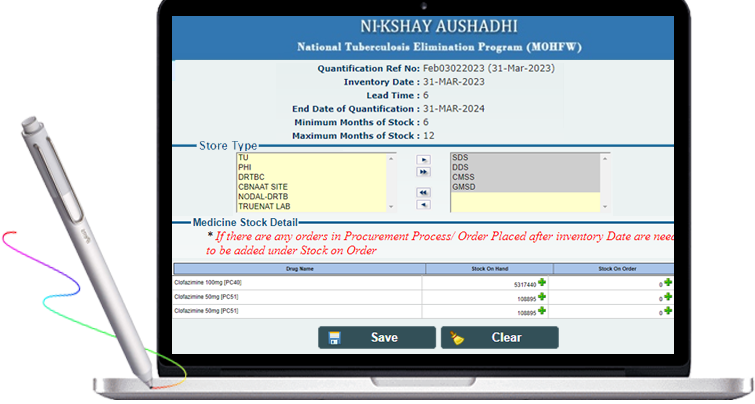
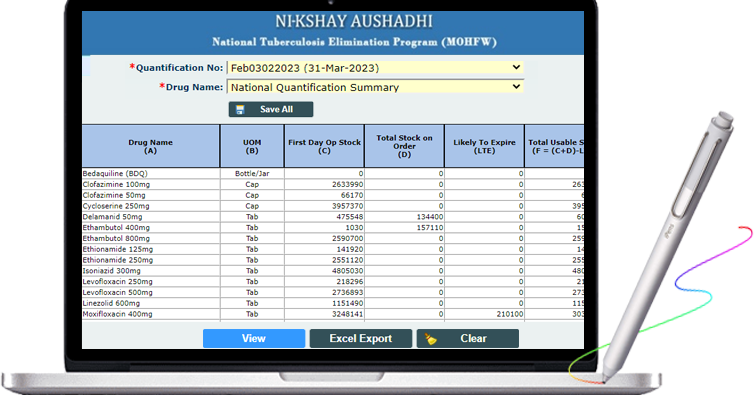
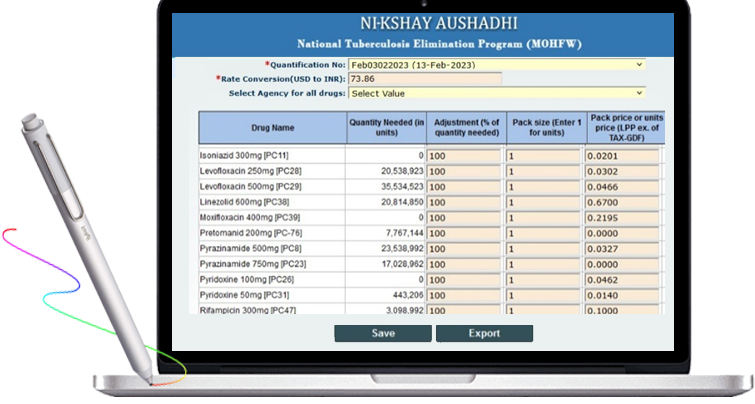
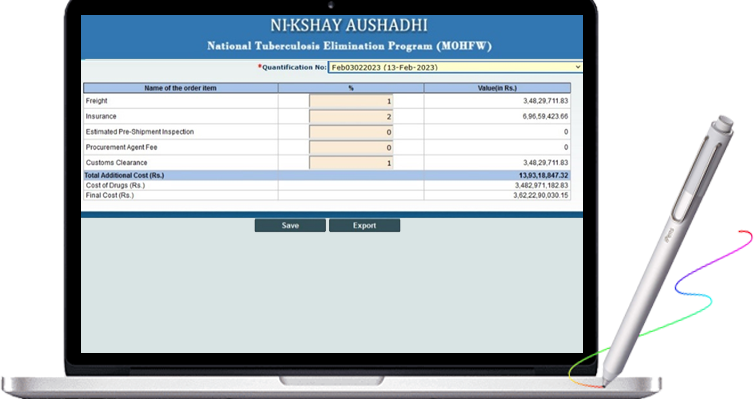
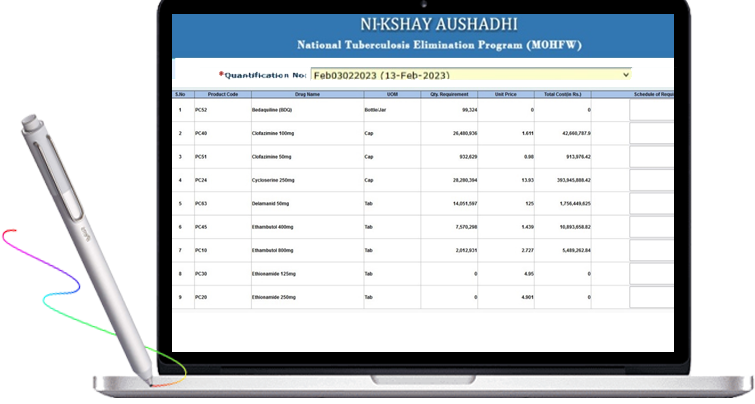
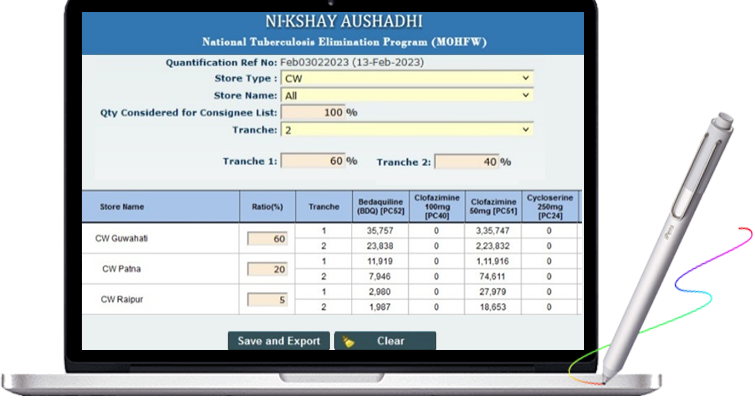
Forecasting & Quantification
Catalog

  • Assemble a national team of experts in a working group to run the TB -quantification process.
  • Gather key inputs and ensure the quality of the data is sufficient to make forecast.
  • Develop a National forecast for the product using the appropriate quantification Steps (e.g. Regimen Master, Parameter Master, Enrolled cases, Expected Cases etc.)
  • Develop a supply plan based on the forecasting exercise
  • Review and adjust supply plans regularly, based on uptake and consumption trends

Forecasting & Quantification Tools and Resources

Quantification is the ongoing exercise which is conducted by the team of stakeholder, consultants, procurement officers and service providers.
This team is involved in the entire forecasting process from data collection to analysis the data.
In addition forecasting result to be validated by the key stakeholders.

01

Regimen Master

As per the guidelines provided by the Central TB Division, user add/modify the regimen in this master. All below mentioned details are added through the regimen master:

  • Regimen name
  • Regimen phase
  • Regimen course type (Monthly / yearly)
  • Drug name
  • Drug per day / week dosages
02

Parameter Master

In this module, User starts its forecasting for monthly / quarterly / yearly as per its requirements.

Forecasting depends on some parameters mentioning below:

  • Inventory Date – Starting date of Quantification.
  • End Date of Quantification – End Date.
  • Lead Time (In Months) – Expected time (in months) to get stock.
  • Minimum Months of Stock – Buffer Stock (In Months).
  • Maximum Months of Stock – Stock in Store (In Months).
  • Regimen – Select the regimen on which forecasting is to be made.

03

Enrolled Cases

Enrolled cases are the number of patients which are already put in treatment under the regimens. These number provide the exact consumption of the drugs and these number provided by the CTD itself. These are the past numbers of patients.

In Addition, This system provides the excel download and upload option to make this system feasible to the user.

04

Expected Cases

Expected cases are the number of patient which will be expected to be in regimens for treatment. These number provide the estimated consumption of the drugs. In addition, these number of patients are assumed by the CTD officials under some guidelines.

In Addition, This system provides the excel download and upload option to make this system feasible to the user.

05

Stock of Medicines

While doing Quantification, the user can consider Stock position at all Store level and Stock on Order (Pipeline) as stock for better forecasting.

For example – Stores like SDS, DDS, CMSS, GMSD, TU, PHI, DRTBC, CBNAAT, NODAL – DRTB and TRUENAT LAB, here only SDS, DDS, CMSS, GMSD stock are take into account.

06

Medicines Detailed Report

Here Quantification answers the question: “How much will be procured and when will it be delivered?” This process of estimating the quantities and costs of the products required for a specific health program (or service), and determining when the products should be delivered to ensure an uninterrupted supply for the program.

Other Sub Reports
Parameter Master Report, Enrolled Patients Report, Expected Patients Report, Summary Report, Individual Medicine Report, Cases Report.

07

Quantity and Cost Report

Based on the calculation in Medicines Detailed Report, this report is generate the final Quantity to be procure and cost involve to procure Drugs.

In this report, User enters current USD value and then selects the Procurement Agency i.e. CMSS and GMSD.

08

Additional Cost Report

Some other charges like Freight, Insurance, Estimated Pre-Shipment Inspection, Procurement Agent Fee, and Customs Clearance are entered to calculate the final Procurement Cost.

09

Procurement Plan Report

This procurement report allows an organization to demonstrate how its procurement activities deliver value for money, contribute to the realization of its broader goals and objectives, and provide a panoramic snapshot of the effectiveness of its procurement strategy.

10

Consignee List Report

The best benefits of delivery scheduling come through the use of Quantification to provide the greatest customer experiences while minimizing costs and maximizing fleet productivity. Below parameters are captured, in this process.

  1. User select the store type, whether it is Central warehouse or GMSD.
  2. How much quantity they want? (100% or Less)
  3. How many schedule they want? (1, 2, 3 or 4)